Note: This is repost of an article I worked on in March 2020 for my Digital Journalism class portfolio. The original article can be found here.
With the Democratic primary underway, voters are looking to political journalism for election recaps and predictions. Innovations in data journalism have made in-depth analyses more accessible than ever for the public. In my last blog post, I compared how different visualizations of the coronavirus outbreak can affect public response. In this post, I will be focusing on how data journalists use statistics and methods to inform their writing and attempts to openly discuss methods with a data-literate audience.
Background: The 2016 Election
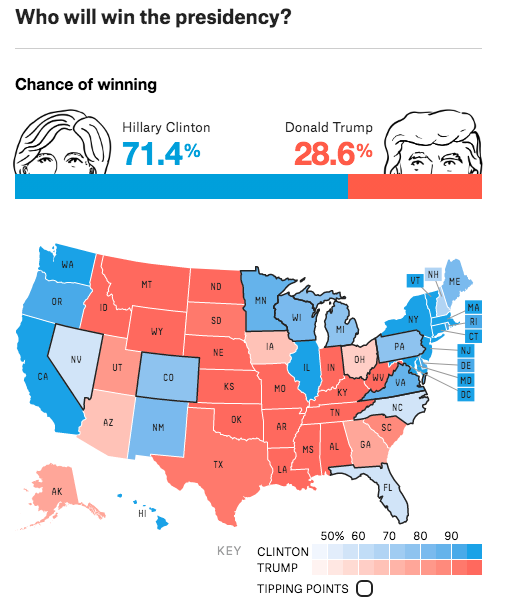
In the 2016 election, many consumers of data journalism were shocked when Donald Trump won the presidency. The New York Times put Trumps’ odds at winning at 15%. Five Thirty Eight, a well-respected political statistics blog, put Trump’s chances at 28.6%. After the election, Five Thirty Eight’s creator Nate Silver published a blog post justifying the prediction, touting his methods as flexible to opinion polling errors. In the final paragraph of his post, Silver says he believes the public should have been “better prepared” for a Trump win. Though Five Thirty Eight makes a great effort to educate their readers on the nuances of their statistical methods, it is unclear if the data literacy of the public is where Silver expects it to be.


The 2020 Democratic Primary
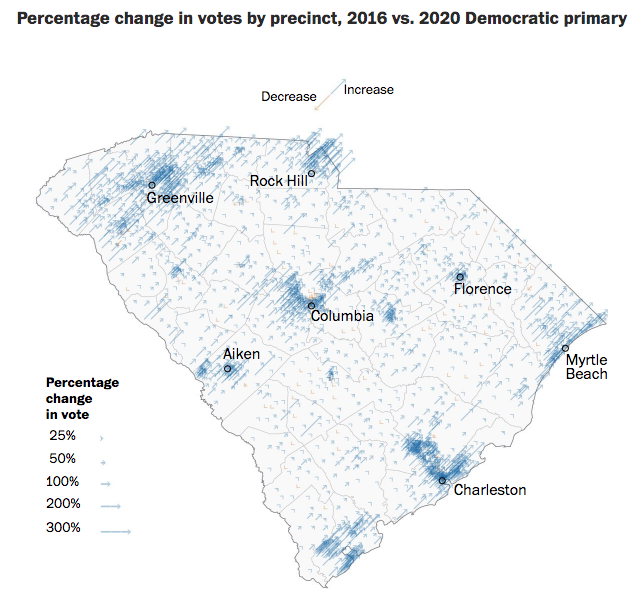
After the South Carolina primary on February 29th, the Washington Post published an article on the changes in turnout from the 2016 primaries. Turnout is not the most common electoral statistic to see reporting on, and it certainly tells a different story than vote margins. The Post uses turnout in this article to suggest that Biden is, “(attracting) different types of energized Democratic voters” and by disaggregating turnout by race, that these voters are largely white.

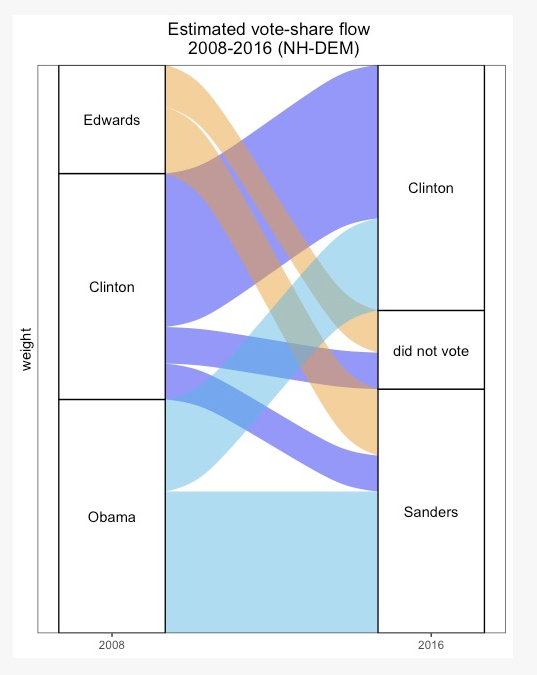
Lenny Bronner, a contributor to this article and a data scientist at the Post, is a main contributor to a new blog, PostCode, dedicated to telling the backend stories of the Washington Post’s articles. In the past, Bronner has blogged on how the methods used by the Post to predict turnout on election nights. Bronner explains that the usual metric, precincts reporting, “can mislead readers.” In a recent post, Bronner dives into a method the Post is using to estimate primary elections. This method, looking at voter flow from one primary cycle to the next, estimates how voter preferences change from one primary to the next. The Post, then, is not only making an effort to diversify statistical methods used to tell political stories but explain those methods to readers. Bronner has not yet responded for comment to this story.[1]

On the audience side, it is still challenging to tell how methods in political data journalism are interpreted. For consumers of data journalism, it can be difficult to parse through the intricacies of different statistical methods used for reporting. Especially for organizations using data journalism to inform their work, correctly interpreting what a set of visualizations or metrics says can be crucial, especially come Super Tuesday. Both the W&M Young Democrats and the Williamsburg James City County Democrats have not yet responded for comment to this story.
[1] Bronner did eventually get back to me, but we have not yet had the time to formally chat.